Daily use of Lut in tube mills around the world
The following section presents actual plant cases of how operators increase productivity with Lut 3.0 true data.
Talk to an expertPrecise mean, minimum and maximum wall thickness
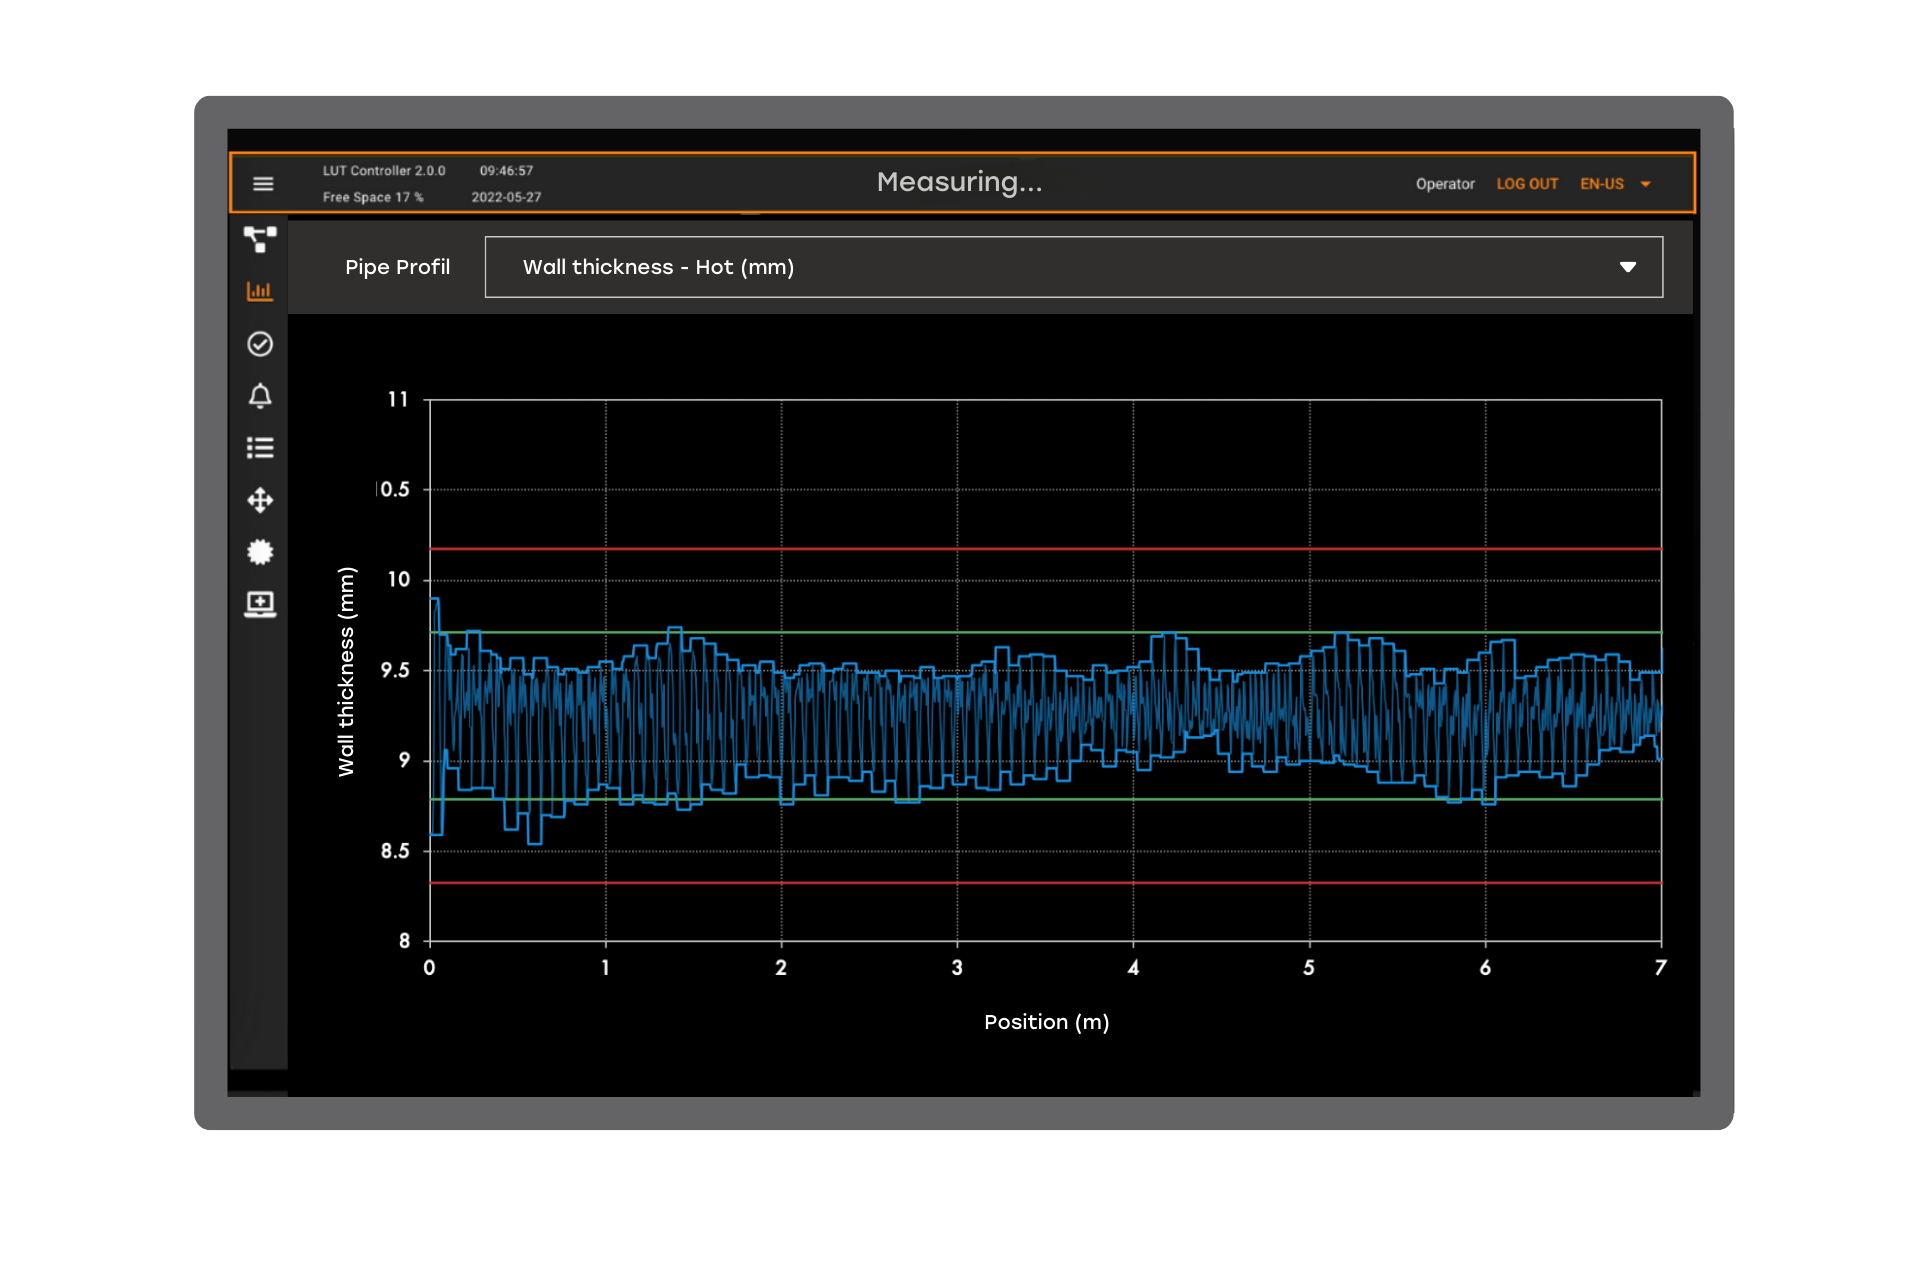
The Lut 3.0 measures all of the most critical tube characteristics. With adjustable tolerance limits built into the profile graph, operators can see at a glance if each tube is within specs.
A typical Lut 3.0 wall profile for a rotating process mill is shown in the figure (blue curve), displaying the wall thickness variation along the length of the tube. Operators can quickly see whether thicknesses are within the acceptable range (green line) and, most importantly, don’t exceed the unacceptable range (red line).
Full cross-sectional measurement
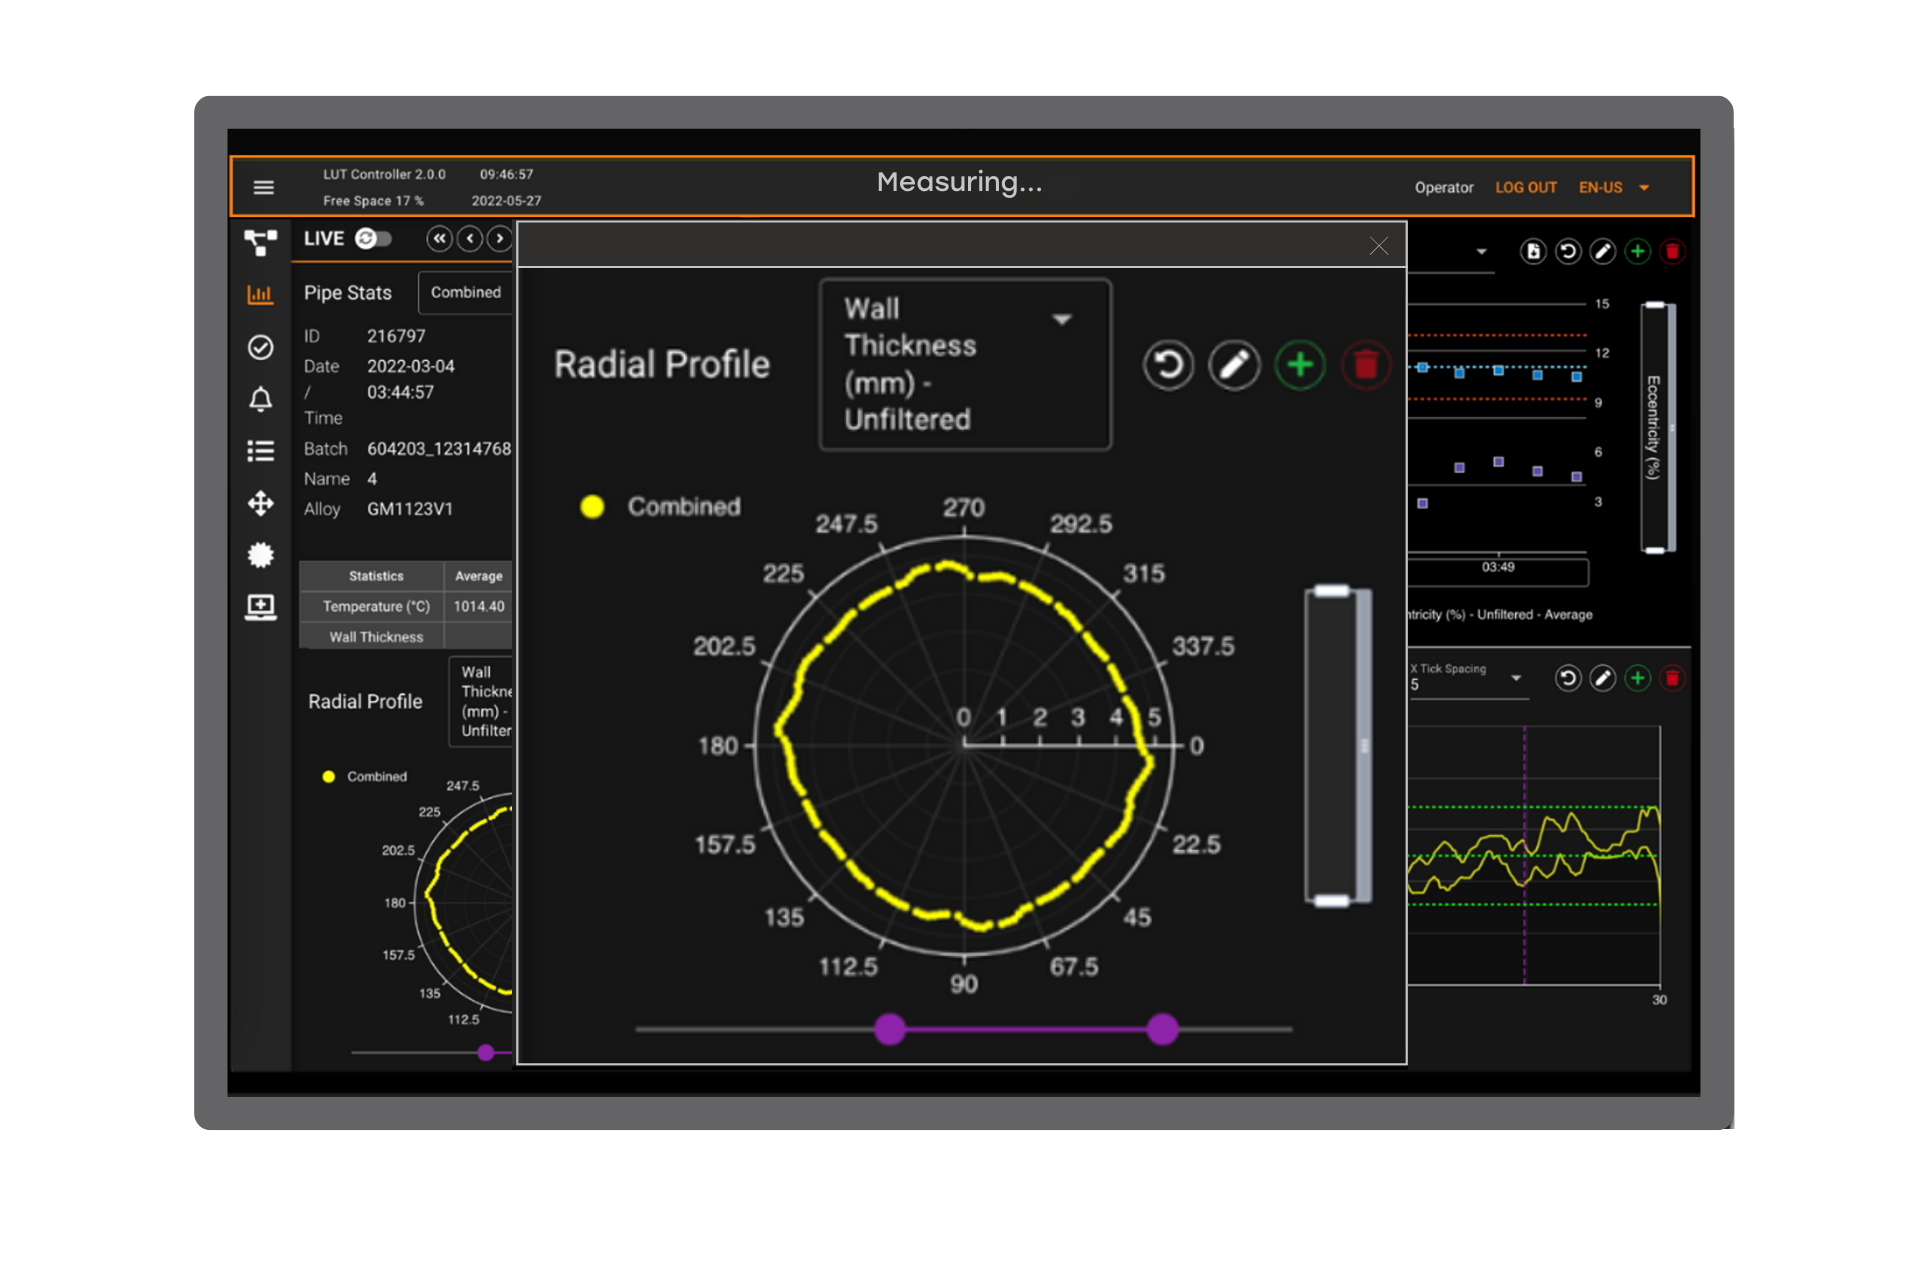
For modern mandrel mills, capsule position adjustment is a key factor in manufacturing radially uniform tubes. The Lut pinpoint measurement generates very high-resolution, cross-sectional profile graphs, allowing tiny features, such as overfill and uneven roll pressure, to be detected.
For example, a cross-section profile measured with the Lut 3.0 (blue curve) is compared to the target value (dash circle) and to the acceptable tolerances (red circle) for a 3-roll capsule processing mill. Although all thicknesses displayed are within the target range, operators may choose to adjust the roll capsule to reduce the slight bump in deformation between the actual cross-section and the target value (dash circle).
Transforming data into efficiency
Lut 3.0 represents a significant advancement in data collection, offering operators an unparalleled insight into production through its cutting-edge dashboard.
Drawing upon Tecnar’s extensive experience in online measurement spanning two decades, Lut 3.0 incorporates sophisticated analytical tools like radial profile analysis and profile cycle analysis. These tools provide crucial insights into production conditions, including roll orientation issues leading to polygonization and the differentiation between piercing and non-uniform billet heating eccentricities. By gathering and translating data into actionable insights, this advanced technology empowers operators to proactively optimize production efficiency.
Heavy ends
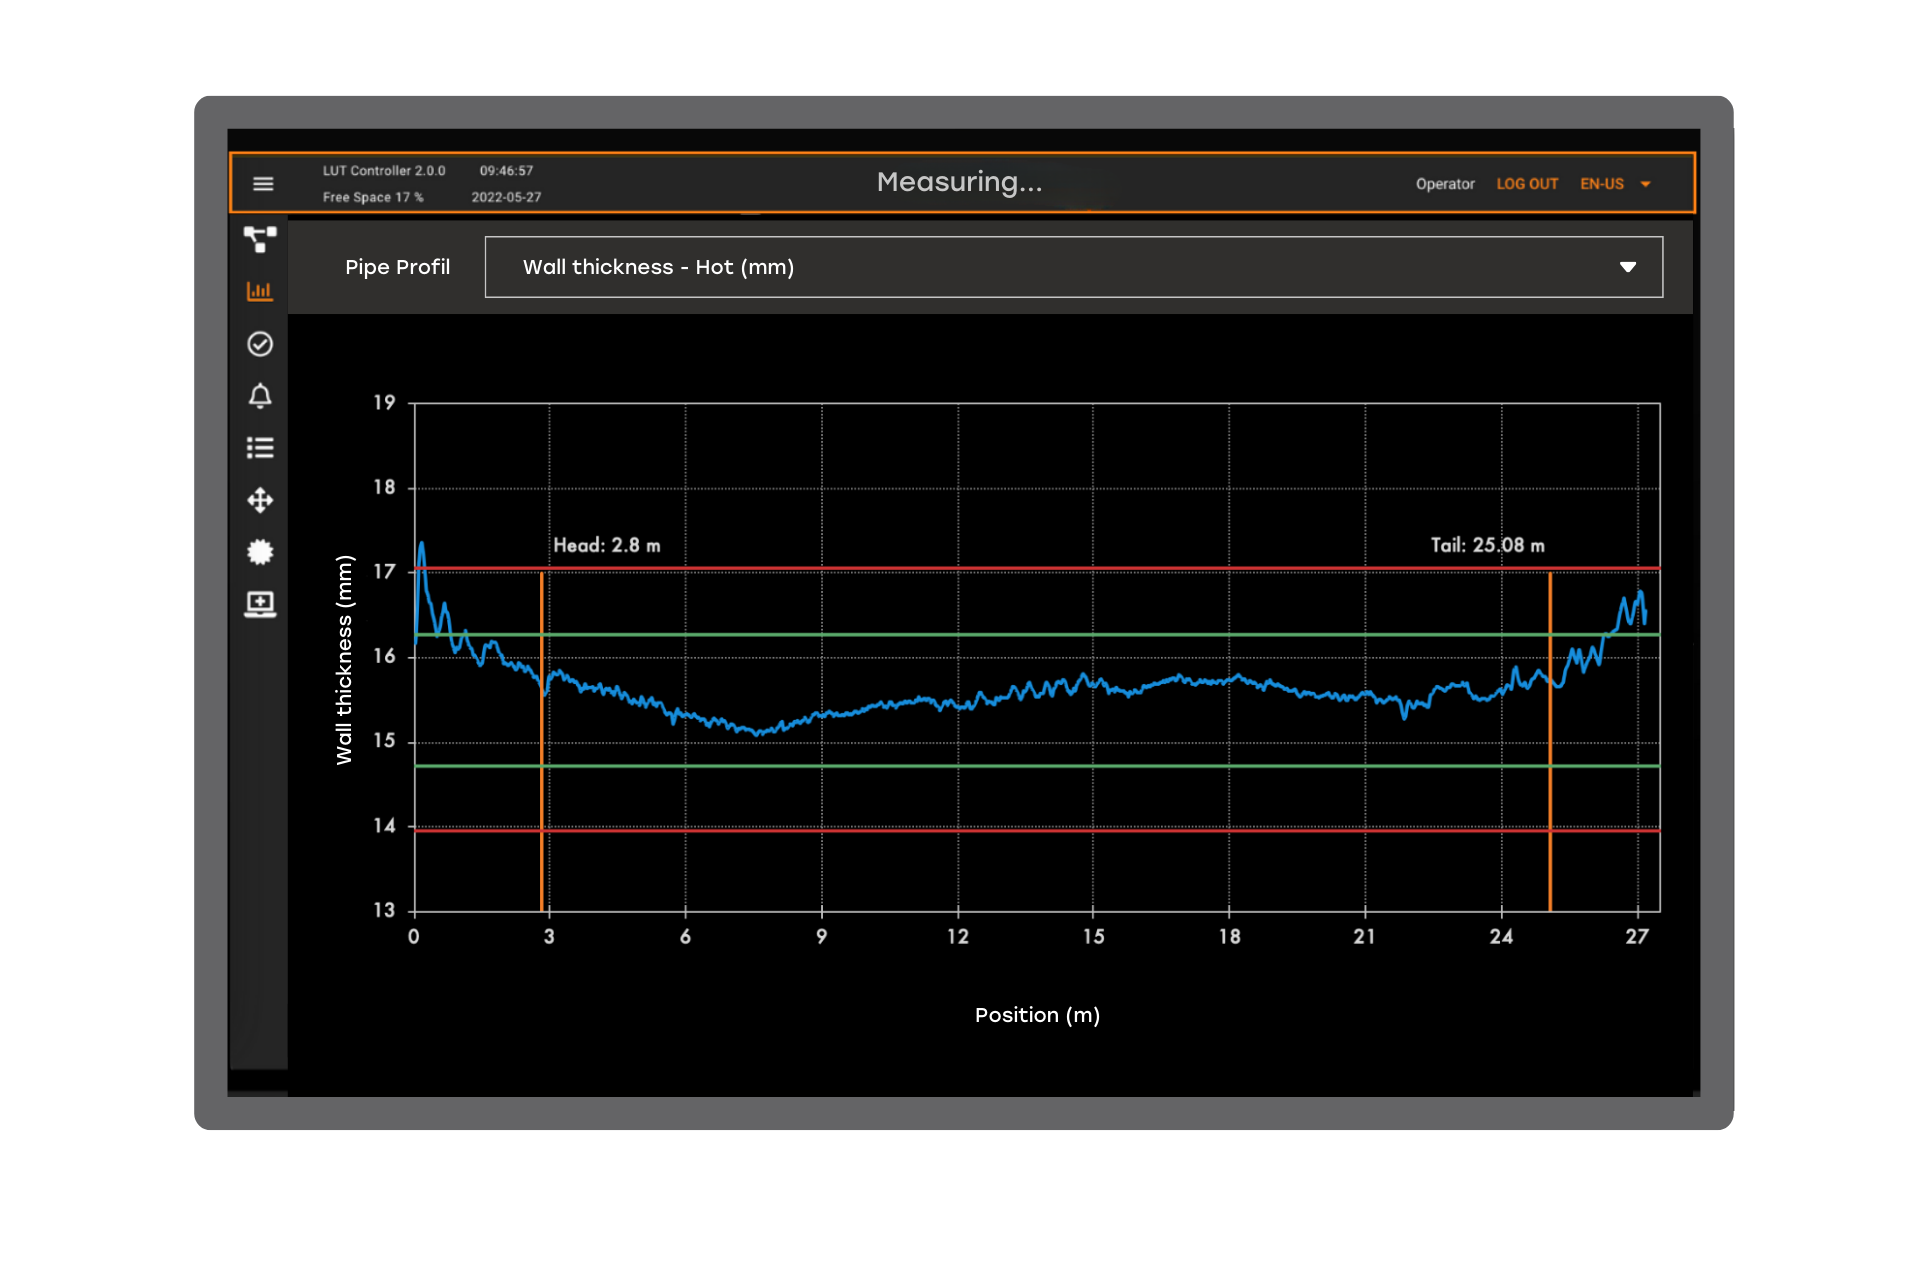
Wall thickness tapering at the ends of tubes is unavoidable in modern mandrel mills, but it can be minimized with proper mill set-up. After optimization at the mandrel mill, the remaining tapered ends can be further corrected in the stretch-reducing process. The Lut 3.0 advanced profile analysis tool automatically detects the position of the tapered ends, making both of these corrections easy.
In this example, the Lut’s advanced profile analysis has automatically identified the location of the end of the heavy head, at a location of 2.8 m, and the start of the heavy tail, at a location of 25.08 m. This information can be transferred directly to the cutting saw for optimal tube trimming.
Monitor the effect of thermal expansion
When production resumes from a cold start, mill thermal expansion affects tube wall thickness. When this effect is not properly controlled as the mill reaches its operating temperature, the mean wall thickness of subsequent tubes may drift from the targeted value. The Lut 3.0 helps operators monitor and control the evolution of mean wall thickness as the temperature of the mill stabilizes.
This example shows a perfect case study of a cold start-up. The data point plot is the average wall thickness of individual tubes as a function of time. As the mill equipment warms up, the product slowly reaches the target thickness while the temperature stabilizes.

Tool wear
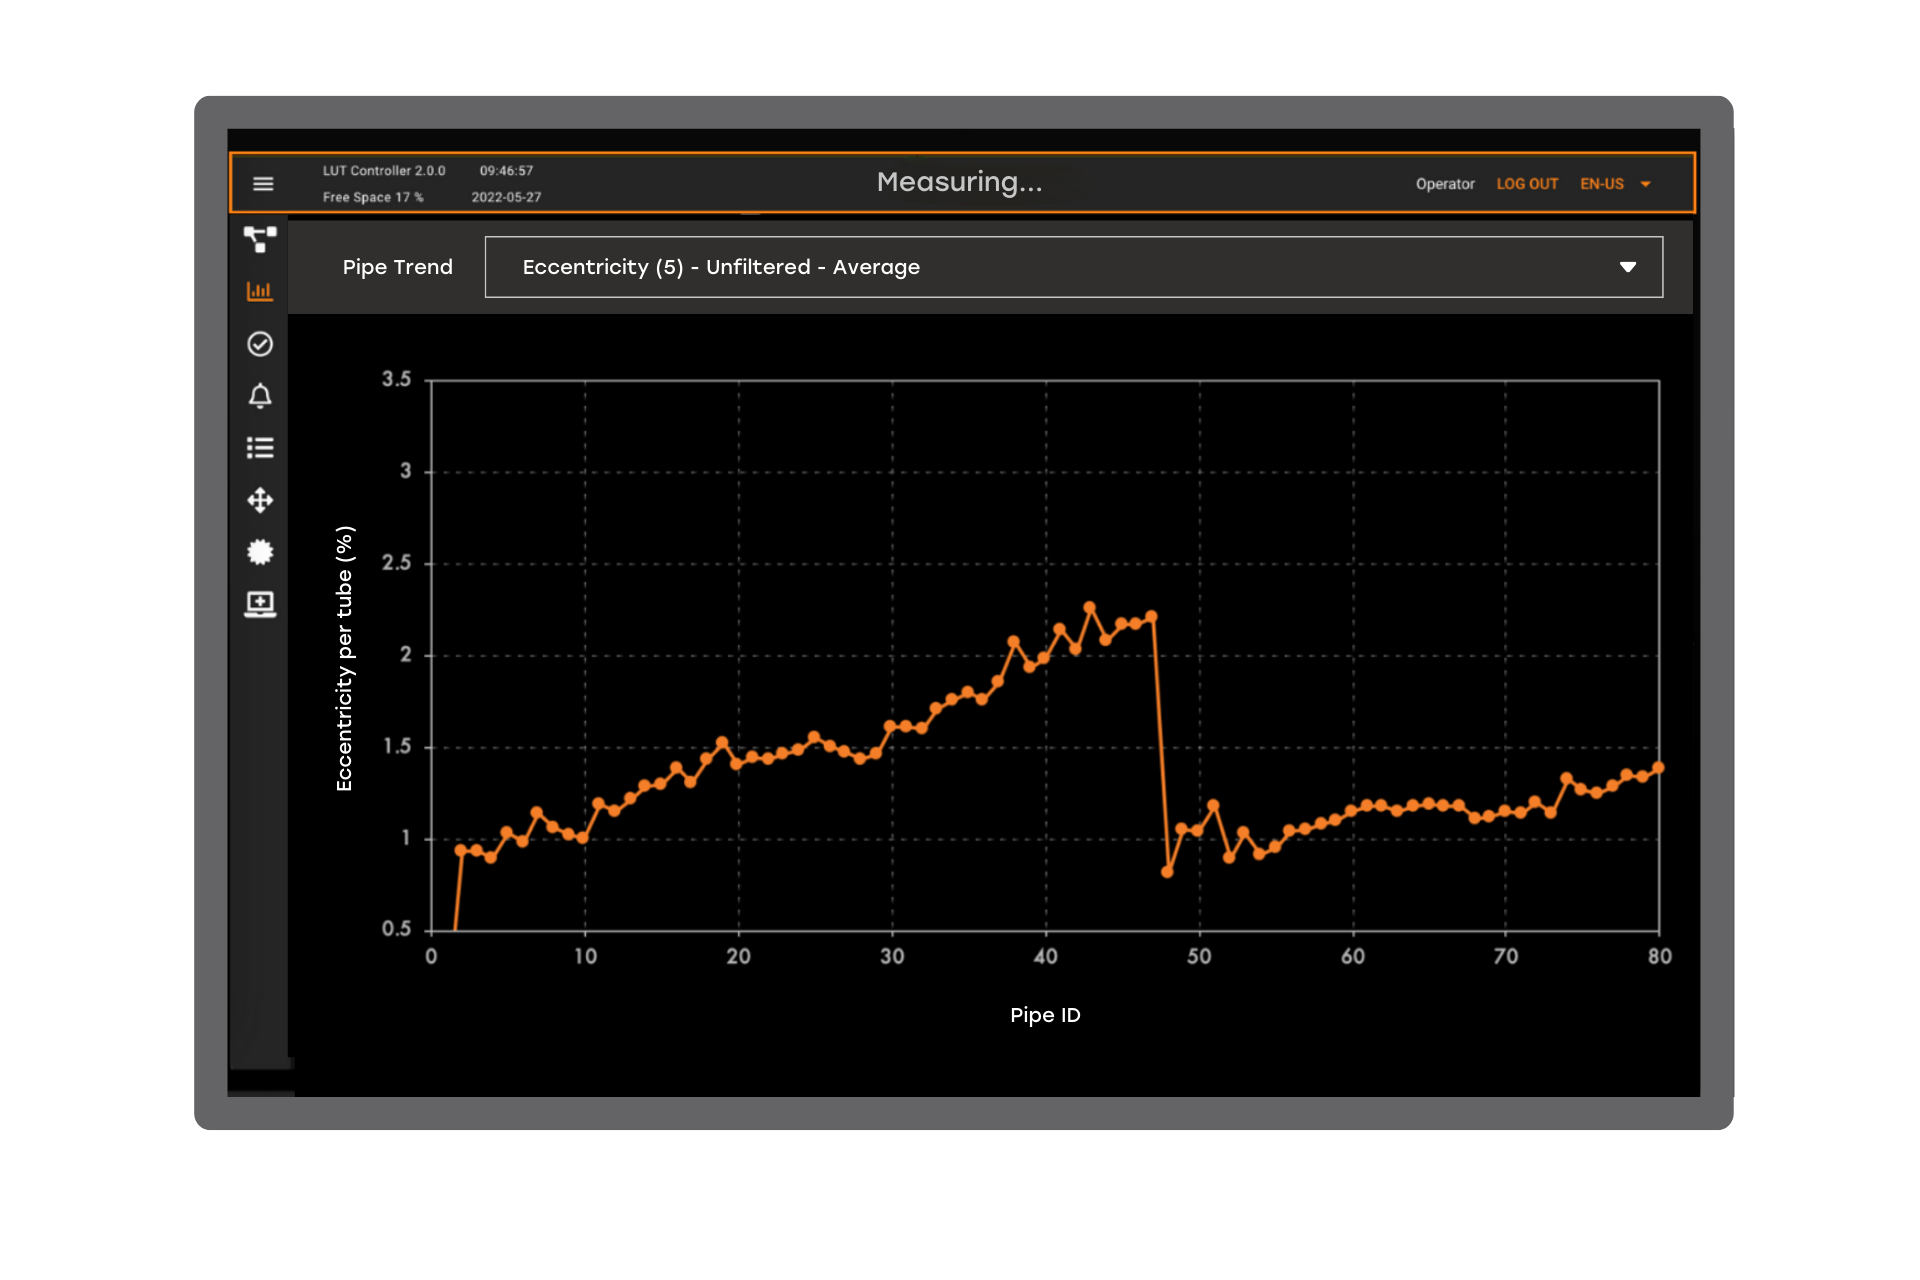
Tool wear is an issue for all tube mills. For example, as the piercer plug wears out, eccentricity increases in the hollow. With the Lut 3.0, operators can monitor the fluctuations of many tubes and quickly spot the effects of tool wear. That means that changes can be implemented before excessive wear can cause significant production loss.
The data-point plot shows the average eccentricity of individual tubes as a function of a production sequence in a piercing mill. As the plug wear increases from contact with the hot steel, operators can see that eccentricity also gradually increases. When the plug was changed, between tube number 47 and 48 in the sequence, eccentricity dropped to almost 0. Operators use the information to change the plug only when required to reduce production interruption.
Rapid detection of defective tools
Any process that requires mandrels may be subject to wall thickness deviation due to a single defective unit in the set. Since they are used in rotation, the defective mandrel will generate a cyclical outlier thickness in the batch. With the Lut 3.0 data, such an issue is rapidly detected and the faulty mandrel can be removed from the set.
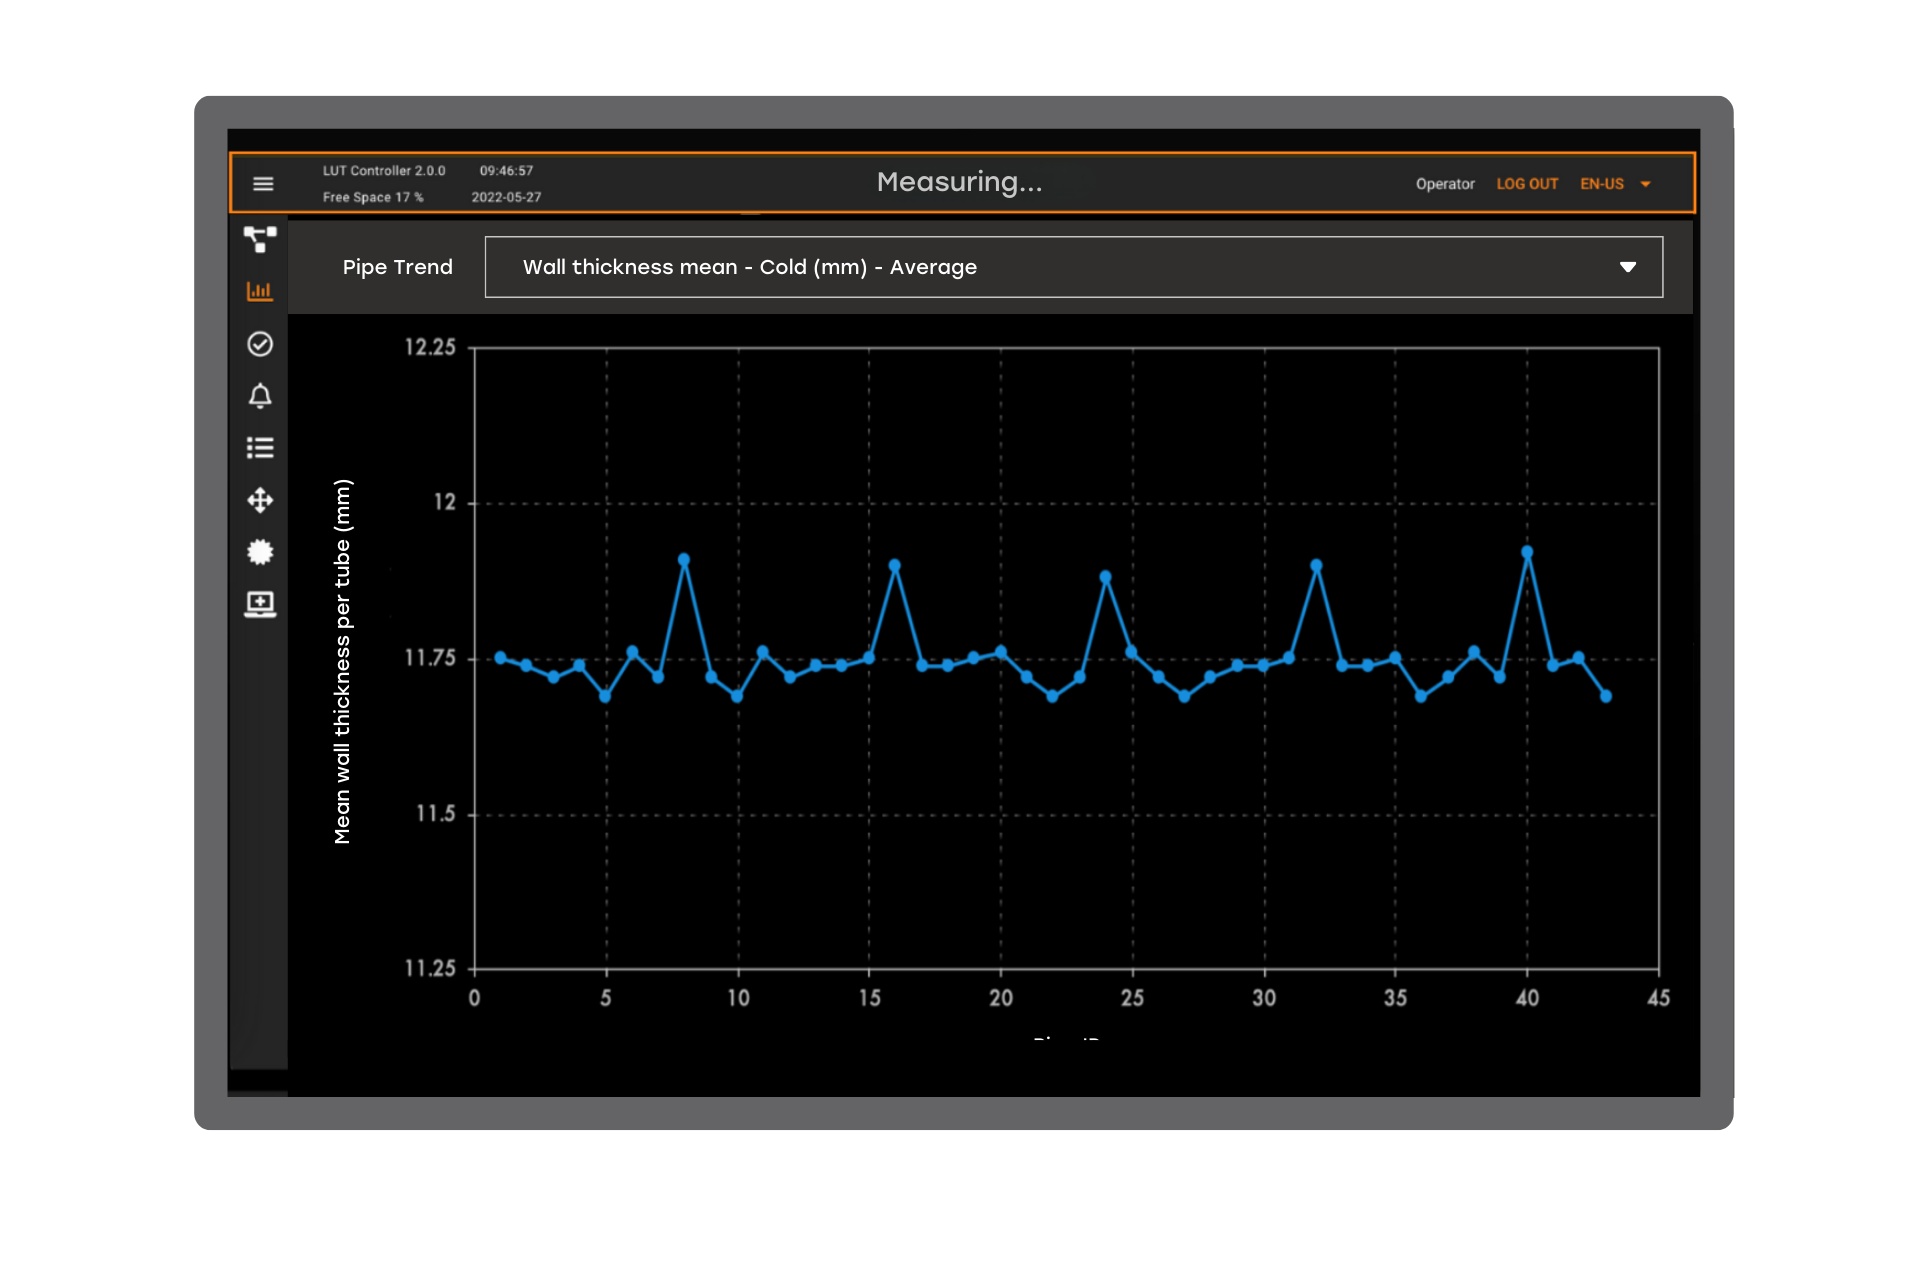
The data-point plot shows the average wall of individual tubes as a function of a production sequence in a push-bench mill. Note that an outlier value is observed at every eight tube. The recurrence of the outliers indicates that there is an out-of-specification mandrel in the piercing mill. With the Lut 3.0 data, the operators can quickly identify the erroneous mandrel and remove it from the set.
Eccentricity
There are many sources of eccentricity in seamless tube manufacturing and each one affects the tube profile differently. Distinguishing between different eccentricity orders and the associated root cause is essential to applying proper corrective measures. By measuring eccentricity directly, the Lut 3.0 advanced profile analysis tool can quantify the different orders individually.
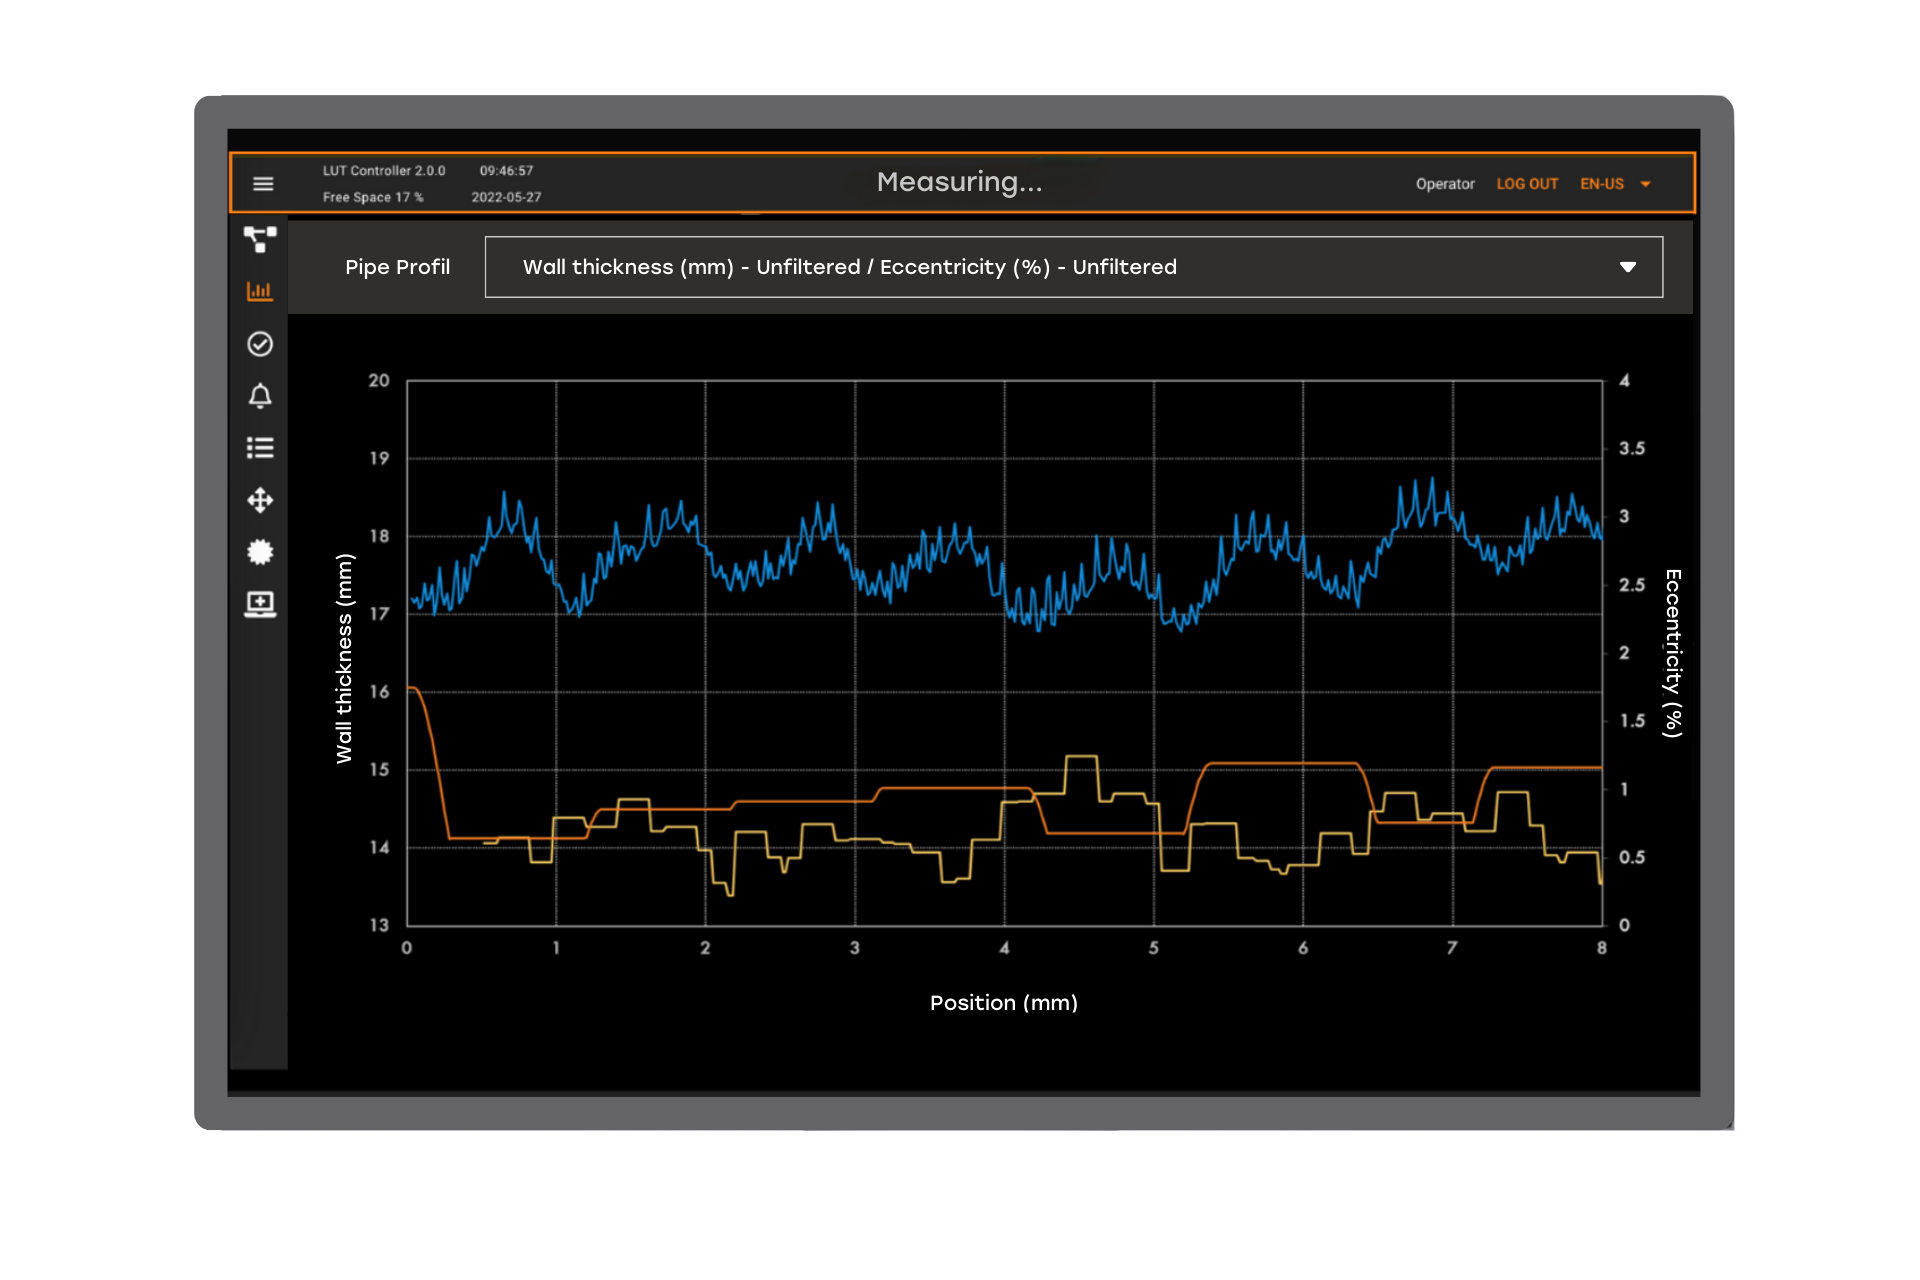
For example, a Lut 3.0 wall thickness profile (blue curve) can be broken into a low cycle (orange curve), caused by an unevenly heated billet, and a fast cycle (yellow curve), caused by piercing mill operating parameters. With this information, mill operators can focus on the source of the issue.
Ready to increase plant yield by 5%
Contact us to learn how to leverage the data from the Lut 3.0 and get a return on your investment in less than 2 years.