
(2018 年 ITA 最佳论文奖获得者)用于热无缝钢管厂生产监控的在线壁厚仪数据新型信号处理
作者:Choquet Eng. Ph.D.
Introduction
Seamless tube manufacturers are under constant pressure to increase yield and productivity of their plants, especially in the current difficult times. Proper process monitoring at every stage of the manufacturing steps is critical in achieving such goals. For seamless tube manufacturing, in particular, there are constant changes in production results due to the unavoidable wear of the production tools. Getting a complete picture of the production process requires the inspection of each and every tube produced at several stages of the manufacturing process. Operators may then be automatically alerted before tube characteristics, such as dimension or temperature, falls outside target ranges. By tracking the slow changes in production parameters due to wear, maintenance may then be planned on demand, instead of on schedule (after a given number of tube produced). In other words, earlier insight changes everything.
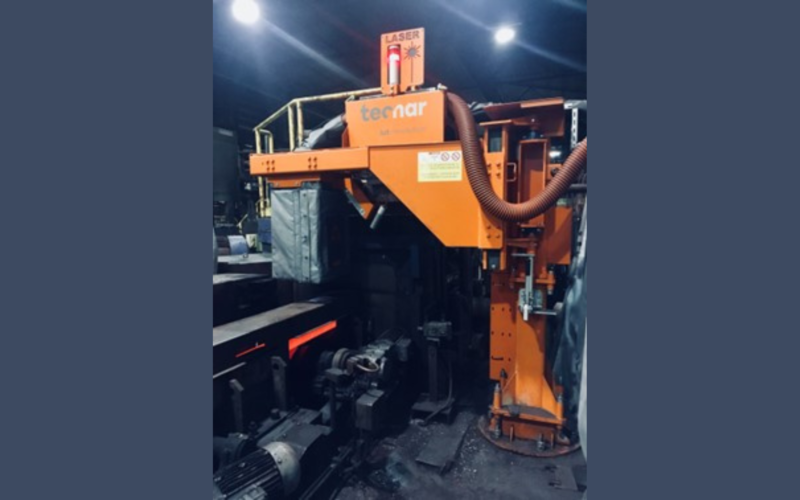
Figure 1 – Lut Revolution
Valuable information is provided to plant operators and plant manager by sensors located at critical locations on the production line. Tecnar’s Lut Revolution (Lut) is one such sensor. The Lut revolution gauge, shown in Figure 1, is a noncontact ultrasonic wall thickness, temperature and length measurement system, specifically designed for process monitoring of hot seamless steel tube production. The wall thickness measurement is based on laser-ultrasonics, which is a novel versatile technology, compatible with every stage of the production process. The Lut may be used immediately after piercing of the billet all the way up to the output of the sizing mill, from the beginning to the end of the hot seamless tube manufacturing process.
Since the sensor is based on noncontact ultrasonics, the presence of the mandrel inside the tube as well as tube motion (both forward, rotational and lateral) has no effect on the capability and on the accuracy of the measurements. The Lut has been specifically designed for use in the harsh condition of a tube mill. By introducing new analytical tool to process the data from the Lut, operators and production managers may quickly understand what’s going on the production mill, react quickly to out-of-specifications conditions, and reach their production goals.
The Lut revolution
The Lut Revolution, shown in Figure 1 at the output of a stretch-reducing-mill, is a sensor based on laser-ultrasonics. Laser-ultrasonics is a technology that combines the accuracy of ultrasonic thickness gauge with the flexibility of an optical system. A first laser is focused on the surface of the tube, causing the generation of short ultrasonic pulse or “ping”. The ping then propagates through the wall of the tube, is reflected by the back wall until it reaches to front surface, the point of origin. The forward and back propagation of the ping is repeat several times, until the sound energy is fully absorbed or scattered by the material of the tube. Each time the ping arrives at the surface, it affects a second laser, the detection laser, which “records” the signal. The detection laser acts as a microphone, listening to the arrival of the pings. By measuring the time between the reception of two successive pings, one may determine the time of propagation of the sound within the bulk of the tube. Knowing the velocity of sound in the hot material, the wall thickness at the precise location of generation of the ping may be measured. Repeating the process along the length of the tube provides an accurate thickness profile.
Since laser light is used to both generate and detect the ultrasonic pulse, the measurement is non-contact and, therefore, not affected by tube motion or tube temperature. In addition, since the ultrasound is reflected by the back wall of the tube, the presence of a mandrel inside tube has no effect on the wall thickness measurement accuracy. As the product is moving under the probe, measurements are taking along the length of the tube, given the operator a wall thickness profile as shown in Figure 2. The operator can then use the information to determine if the product at this location is within the target specifications or if remedial actions are required.
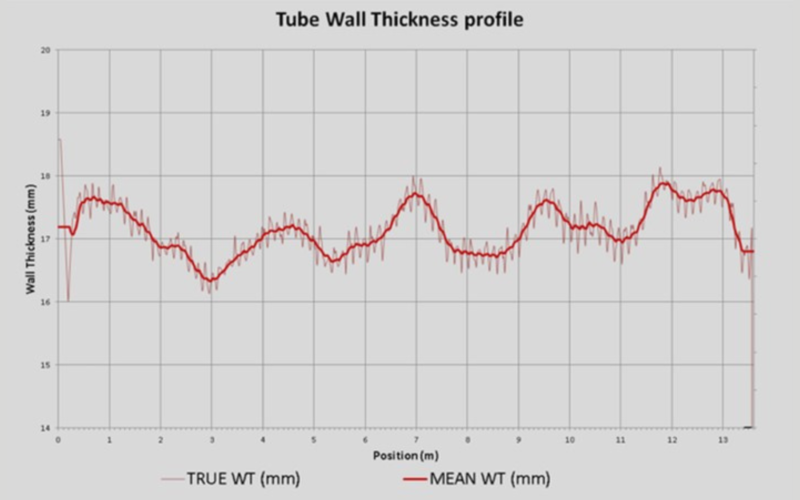
Figure 2 – Typical wall thickness profile
Information from wall thickness profile
With the information provided with each wall thickness profile, the operator can quickly, in a first step, verify that the wall produced is within the nominal target values. The operator may then stop production to react if out of specification conditions are observed and reduce the production of “scraps”. Production yield may also be increasing by tracking the length of heavy or light wall at both ends of the tube. Using the wall thickness profile, operator may adjust production parameters and directly see the impact on the useable length of tube. Figure 3 shows a typical Lut wall thickness profile obtained from a tube with heavy ends. When modifying a parameter, such as the insertion or extraction speeds, the operator may immediately view the impact of his action on the wall thickness of the tube.
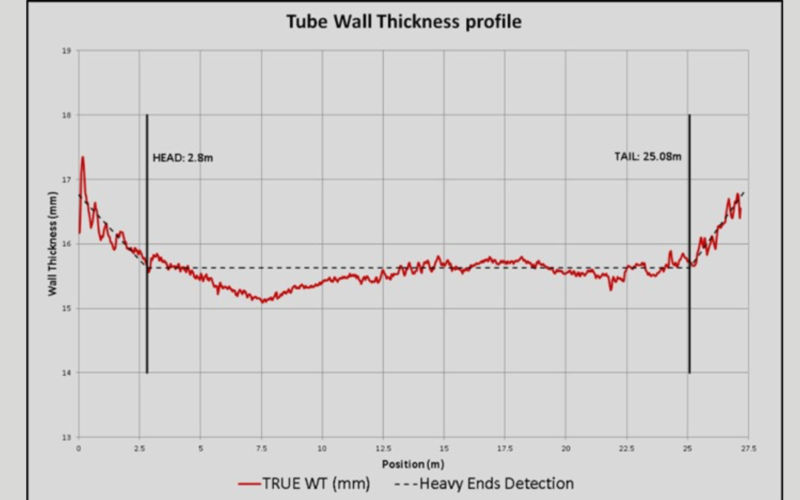
Figure 3 – Profile with heavy ends
Such profile analysis can be further expended. However, in order to better understand the analysis, it is important to understand the source and type of eccentricities produced in seamless tube manufacturing, and its impact on the wall thickness profiles.
Eccentricity in seamless tube manufacturing
Low eccentricity is of prime importance for most seamless steel tube application. Eccentricity, for seamless tube manufacturing, is defined as the offset and/or deformation of the inner wall of the tube with respect to the outer wall. It is generally the results of misfunction or of wear in the manufacturing process. It is an unavoidable result of the process that can be, however, managed and controlled. Eccentricity is generally produced at the beginning of the seamless tube manufacturing process. Given its nature and shape, it is usually not possible to correct eccentricity using downstream processes. Therefore, it is of prime importance to detect eccentricity formation as soon as possible, to quickly identify the source of the eccentricity, and to take the proper remedial actions.
The eccentricity of a tube may be expressed in the term of “order”. The order corresponds to the cycle or frequency at which the wall thickness varies from a minimum value to a maximum value over a full circumference of the tube. For example, if the inner wall of the tube is round but has a slight centering offset with respect to the outer wall, as shown in Figure 4, the measured wall thickness will go from a minimum wall to a maximum value, then back to the initial minimum wall. Hence, for wall thickness measurements over the full circumference, one will see one cycle or first order eccentricity. Such first order eccentricity is often encountered in a piercing press mill. If the piercing mandrel is slightly of off-centered, the inner pierced hole will be off-centered, resulting in an eccentric hollow.
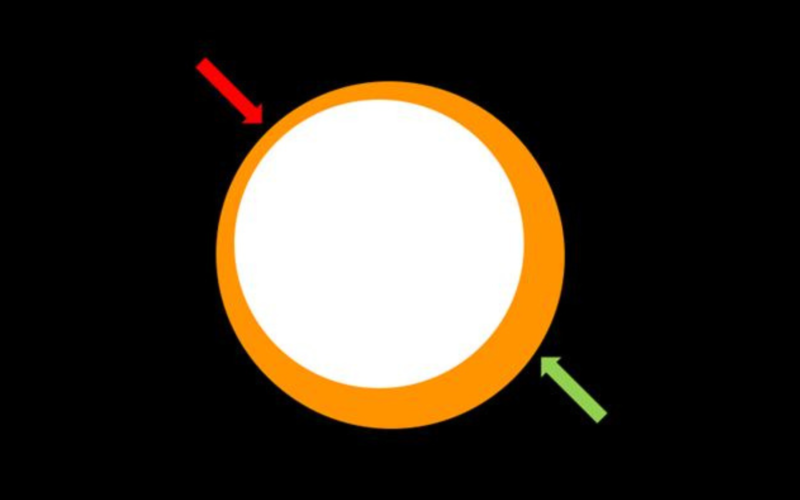
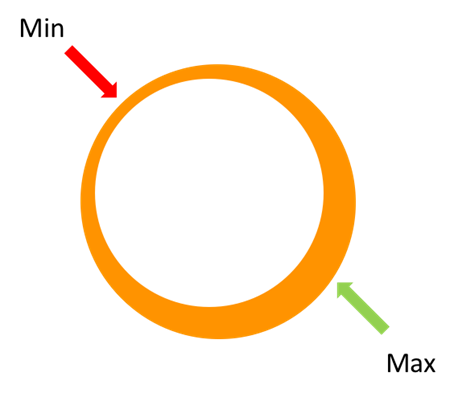
Figure 4 – First order eccentricity
Other manufacturing process may yield different orders of eccentricity. As shown in Figure 5, a two-roll piercing process applies pressure on the hollow on two-sides, resulting in some bulging. The pierced tube will generally have an elliptic inner shape. Measuring the wall thickness over the full circumference will show two locations with a minimum wall thickness and two locations with a maximum wall thickness. Hence, we will have two cycles or second order eccentricity.
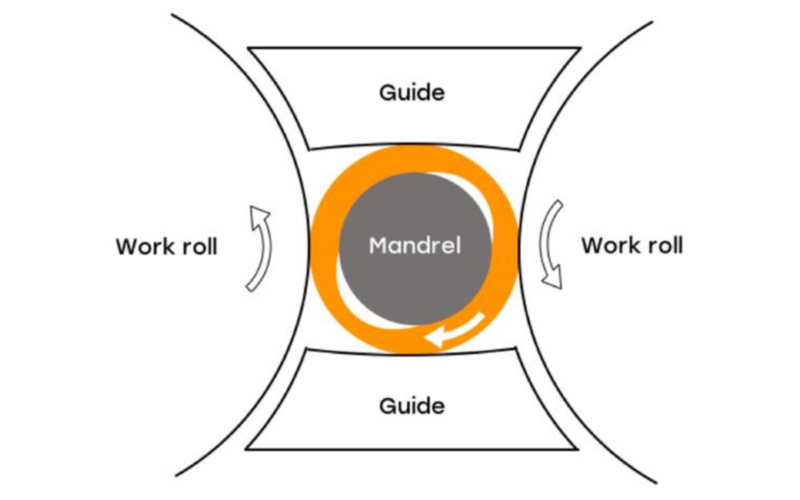
Figure 5 – Second order eccentricity
It should be noted that for a rotary piercing process, the eccentricity is “rotating” as a function of the length of the tube. Measuring the wall thickness along a single line will provide a direct observation of the cycle resulting from the inner elliptical shape. For rotary processing mills, a single axis wall thickness profile is sufficient to provides good information of the eccentricities of all orders.
More complex shapes of the inner of seamless tube leads to the formation of eccentricity of higher order. For example, the case of a triangular shape of the inner wall will results in third order eccentricity. Such inner triangular shape is often encountered with a three-roll processing mill, as shown in Figure 6. As the rolls applies pressure on the tube only along three specific plane, the wall is slightly flattened along these three planes, yield a slightly triangular inner shape.
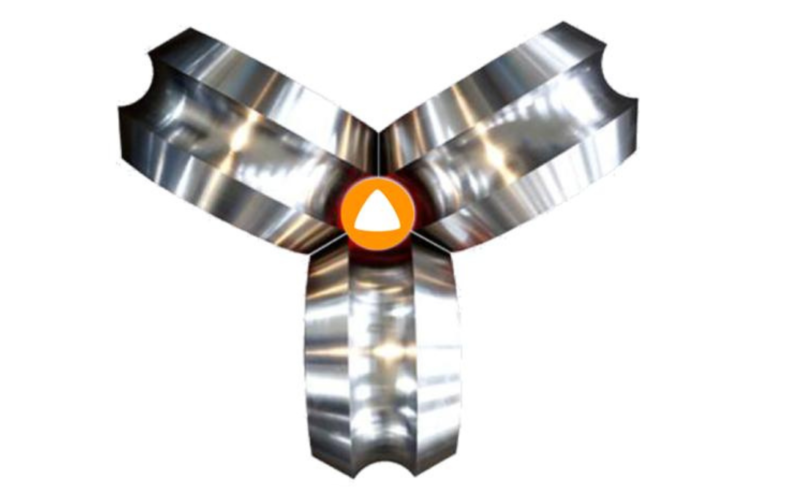
Figure 6 – Third order eccentricity
More generally, it can be shown that a processing stand of a mill with N rolls will produced eccentricity of N order. In addition, as such processing mill are setup with alternating positioned roll sets, 2N order of eccentricity is also observed. Moreover, it can be shown that the contribution of each order of eccentricity essentially is added to provide the overall eccentricity of the tube.
In summary, an order of eccentricity is essentially the number of cycle of going from a minimum wall thickness value to a maximum wall thickness value along the circumference of the steel tube or hollow. The order of eccentricity may help identify the source of the eccentricity. For example, first order eccentricity is generally caused by non-uniform heating of the billet or from a de-centered piercing mandrel. Second order eccentricity is generally caused by two-roll piercing process. More generally, N-order eccentricity and 2N-order eccentricity are generated by alternate stands of N-roll process mill.
Higher order of eccentricity may also be observed by the combination of processing mills, as the eccentricity formation is cumulative. For example, a two-roll piercing process followed by an alternate stand of three-roll process will results in two+six or eight order eccentricity. More generally, any wall thickness profile can be decomposed as a sum of cycles, or eccentricity orders, allowing operator to get more information on the seamless tube manufacturing process.
Wall thickness profile decomposition
As described previously, the wall thickness profile contains a rich amount of information, which is not routinely used in seamless tube production. To better understand such capability, let us review an example from a seamless steel mill with a rotary manufacturing process.
Figure 7 shows a wall thickness profile measured online on a hot seamless steel tube with Tecnar’s Lut at the output of a rotary process. The profile was taken along a single line on the top section of the tube. As shown in the figure, several cycles are observed. On further study, one can identify three cycles in the wall thickness profile: a slow cycle, and intermediate cycle and a fast cycle. It is possible to extract the information from each cycle and provide the operator with a clearer picture of the source of eccentricities.

Figure 7 – Raw online wall thickness profile of eccentric tube
By applying a low-pass filter on the thickness profile, one may isolate the slow cycle. From investigation of possible sources, we have found that the origin of the cycle is from non-uniform heating. A non-uniform heating will result in zones which are “softer”, slightly “pulling” the mandrel in the direction of the softer material.
By applying a high-pass filter on the thickness profile, one may isolate the fast cycle. As the fast cycle is almost in-sync with the rotation frequency of the processing mill, one may link to origin of the eccentricity to tools of the process. In the present case shown, the fast cycle has been demonstrated to be linked to plug wear.
Finally, by applying an intermediate band-pass filter on the thickness profile, one my isolate the intermediate cycle. The intermediate cycle is generally mill related, in the sense that it is specific to a mill or plant process. In the case shown, we have been able to link the intermediate eccentricity cycles to a problem with the hollow.
As shown in Figure 8, the full wall thickness profile may be decomposed into three wall thickness profiles, each providing valuable information the operator. By tracking individually each cycle, the operator may react on the heating furnace, on the plug or on the hollow depending on which signal has reached a threshold requiring a remedial action.
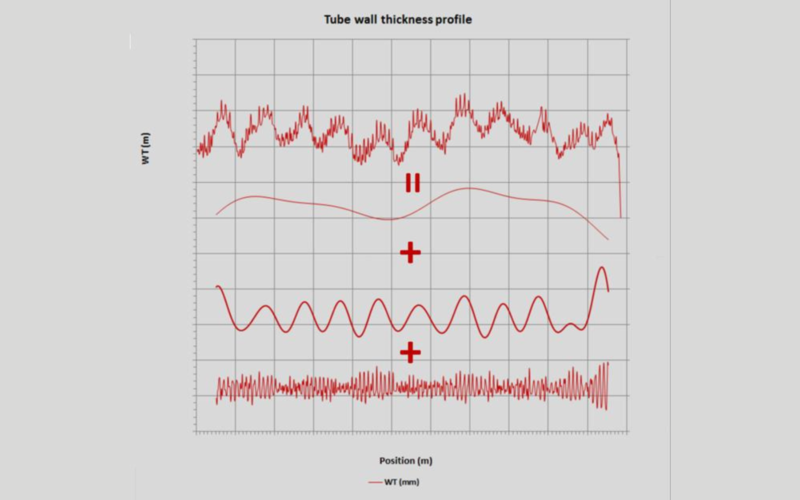
Figure 8 – Decomposition of wall thickness profile
The previous example is for a case of a manufacturing process where the tube is rotating. In many modern mills, the manufacturing process does not rotate the tube and eccentricity is observed with a more or less a constant feature throughout the length of the tube. The same analysis as with the previous case may be applied by imposing a rotation to the tube when passing under the wall thickness gauge. However, this may not always be feasible due to limited available space on the plant floor.
An alternative is then to rotate the wall thickness probe. The Lut has a configuration with two probes, one on top and one on the bottom, mounted on a swiveling device providing data acquisition over the full circumference of the tube. The sensor records the wall thickness data at several location along the length of the tube and at several angle with respect to the circumference of the tube. The data may then be displayed either as function of the length, as in the previous example, or as function of the angle of acquisition. An angular display, as shown in Figure 9, provides information to the operator at specific angles, such as the angle of the roll of a retained mandrel mill. Knowing at which angle wall thickness issues occurs, the operator may determine which roll stands needs to be adjusted.
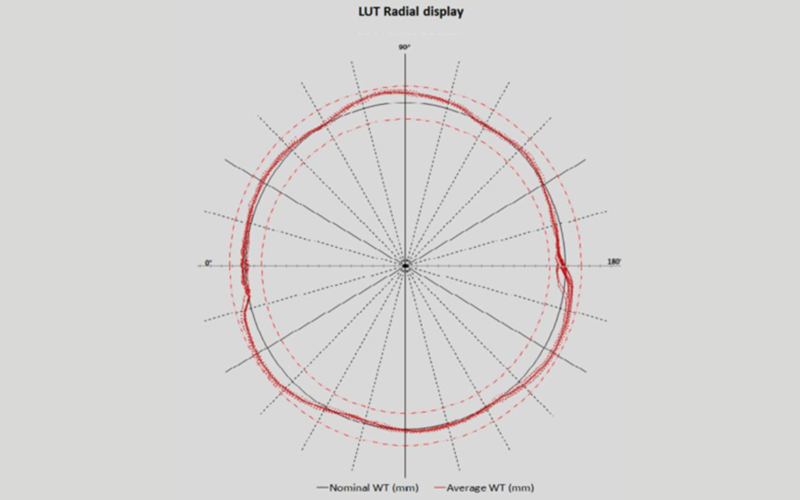
Figure 9 – Radial wall thickness profile
Conclusion
Low eccentricity is of great value for seamless tube manufacturers. Online accurate non-contact wall thickness sensor is a valuable tool to achieved such low eccentricity. The Lut Revolution, with its flexible affordable non-contact ultrasonic technology, provides valued information on wall thickness and eccentricity at all stage of the seamless tube manufacturing process. Real-time display allows operator to verify that production is within tolerance goal, to track production degradation, and to adjust setting in order to achieve production goals.
More advanced signal processing and display enables operators to better address production issues. Understanding the source of eccentricity and its impact on the wall thickness profile enable rapid reaction and increased productivity. By tracking the various eccentricity cycles from wall thickness profile decomposition, production change from tool wear, for example, may be predicted and intervention planned in advance. Maintenance can than move from a reactive mode, where repairs are done when some unfortunate event occurs, to active mode, where maintenance in planned based on data, avoiding down time and extending production time.
(本文最初发表于 2018 年《ITATUBE Journal》杂志)
本文荣获 2018 年 ITA 最佳论文奖